 Trump has begun another trade war. Here's a timeline of how we got here
 Canada's leader laments lost friendship with US in town that sheltered stranded Americans after 9/11
 Chinese EV giant BYD's fourth-quarter profit leaps 73%
 You're an American in another land? Prepare to talk about the why and how of Trump 2.0
 Chalk talk: Star power, top teams and No. 5 seeds headline the women's March Madness Sweet 16
 Purdue returns to Sweet 16 with 76-62 win over McNeese in March Madness
Cities with the most expensive homes in the Oxnard metro area
Purchasing a home is one of the most important investments there is. More than a place to live, homeownership is an asset with the potential to tremendously rise in value. But with home prices reaching record heights, affordability plays a huge role for buyers.
The typical home value in the United States was $357,377 in February, 2.1% higher than the year before.
High mortgage rates are also making monthly payments more expensive; as of March 20, the 30-year fixed mortgage rate sits at 6.67%.Although home prices have inflated all across the U.S., there are some cities that command a higher price tag than others. Location, size, age, and condition are all contributing factors to home value.
Stacker compiled a list of cities with the most expensive homes in the Oxnard metro area using data from Zillow. Charts show the monthly typical home value since January 2018. All 17 cities and towns with data available were included in the list.
You may also like: Highest-rated Mexican restaurants in the Oxnard area by diners
#17. Frazier Park, CA
- Typical home value: $314,602
- 1-year price change: +3.4%
- 5-year price change: +49.9%
#16. Piru, CA
- Typical home value: $537,318
- 1-year price change: +2.4%
- 5-year price change: +31.6%
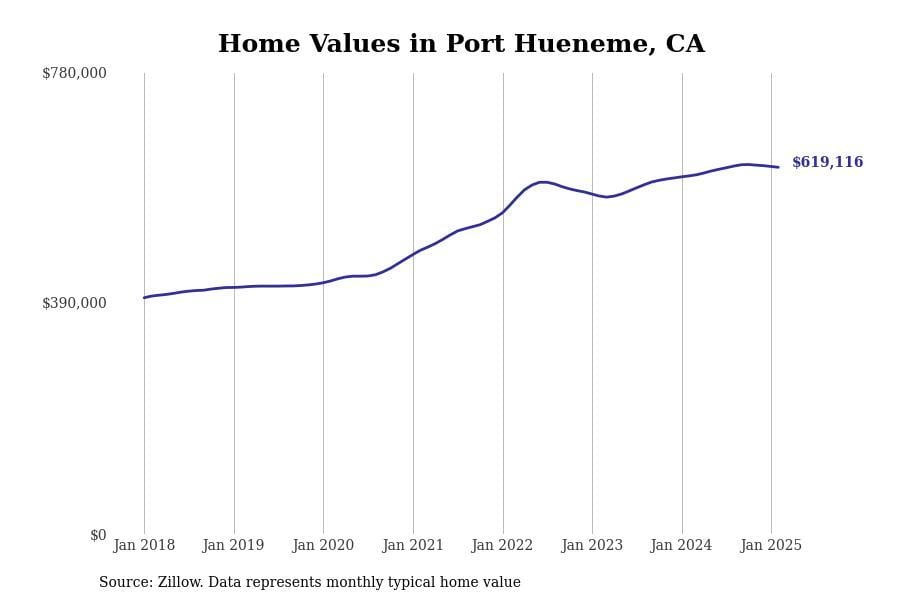
#15. Port Hueneme, CA
- Typical home value: $619,116
- 1-year price change: +2.4%
- 5-year price change: +45.0%
#14. Fillmore, CA
- Typical home value: $684,357
- 1-year price change: +3.2%
- 5-year price change: +39.2%
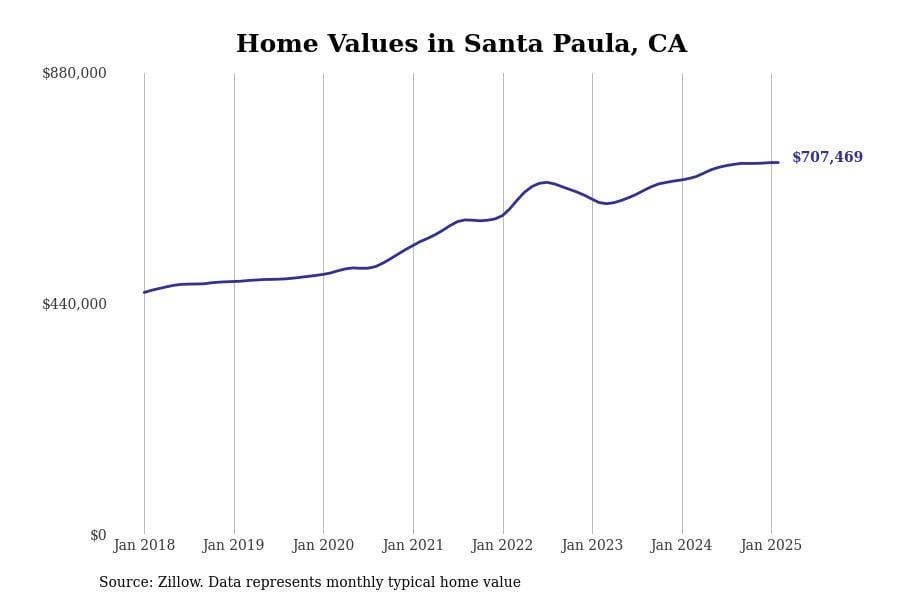
#13. Santa Paula, CA
- Typical home value: $707,469
- 1-year price change: +4.5%
- 5-year price change: +42.3%
You may also like: Highest-rated cafes in the Oxnard area by diners
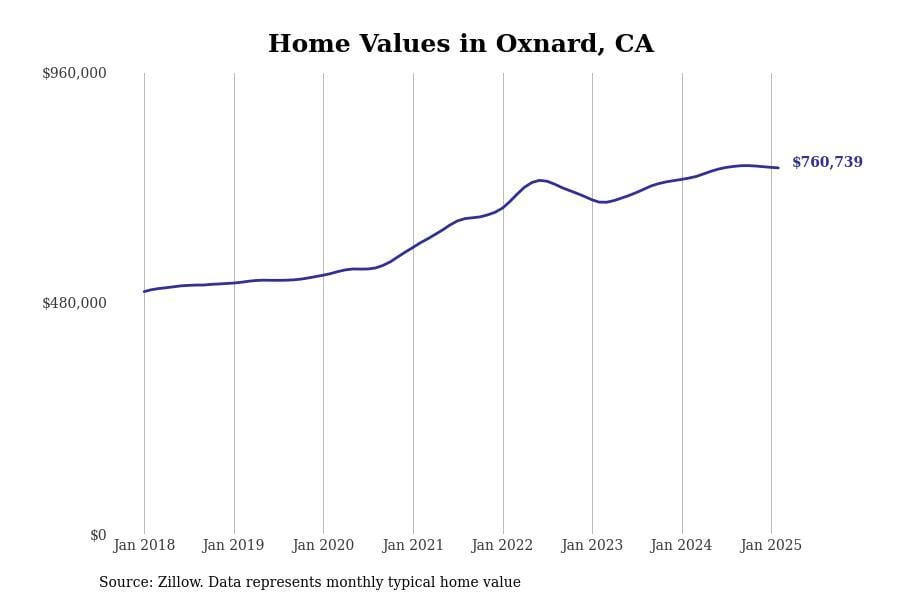
#12. Oxnard, CA
- Typical home value: $760,739
- 1-year price change: +2.9%
- 5-year price change: +40.6%
#11. Simi Valley, CA
- Typical home value: $852,273
- 1-year price change: +3.8%
- 5-year price change: +40.7%
#10. Oak View, CA
- Typical home value: $881,111
- 1-year price change: +1.7%
- 5-year price change: +40.9%
#9. Ventura, CA
- Typical home value: $889,380
- 1-year price change: +2.4%
- 5-year price change: +42.5%
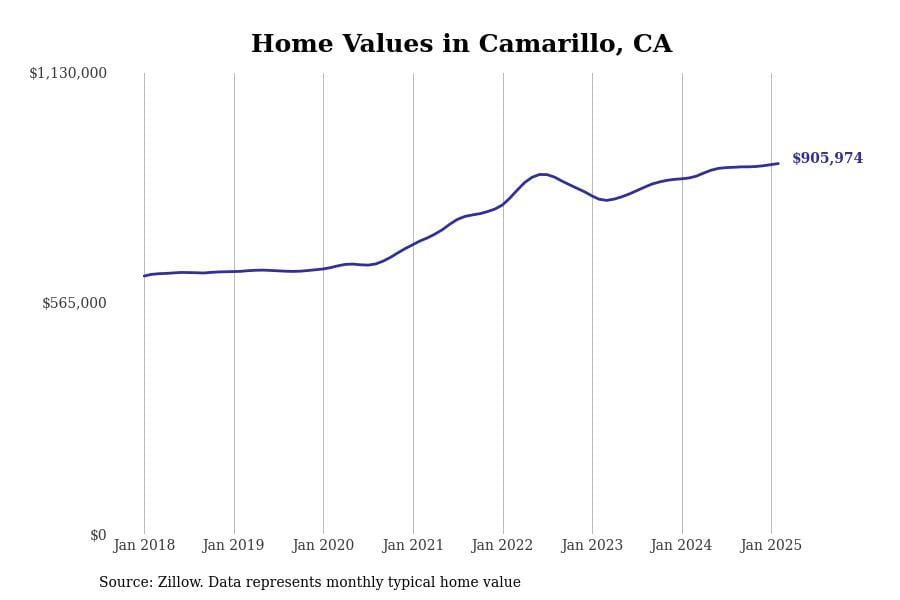
#8. Camarillo, CA
- Typical home value: $905,974
- 1-year price change: +4.0%
- 5-year price change: +39.1%
You may also like: Highest-rated fine dining restaurants in Oxnard by diners
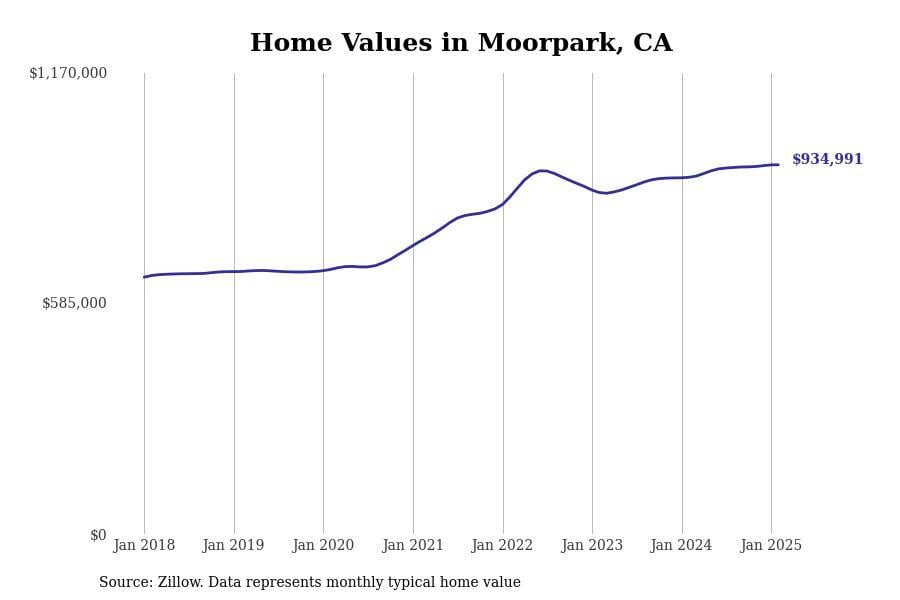
#7. Moorpark, CA
- Typical home value: $934,991
- 1-year price change: +3.5%
- 5-year price change: +39.6%
#6. Thousand Oaks, CA
- Typical home value: $1,043,419
- 1-year price change: +2.6%
- 5-year price change: +39.8%
#5. Oak Park, CA
- Typical home value: $1,126,176
- 1-year price change: +2.5%
- 5-year price change: +41.6%
#4. Ojai, CA
- Typical home value: $1,144,486
- 1-year price change: +2.1%
- 5-year price change: +49.9%
#3. Westlake Village, CA
- Typical home value: $1,491,653
- 1-year price change: +2.4%
- 5-year price change: +46.2%
You may also like: Highest-rated Italian restaurants in Oxnard by diners
#2. Somis, CA
- Typical home value: $1,542,976
- 1-year price change: +1.5%
- 5-year price change: +40.6%
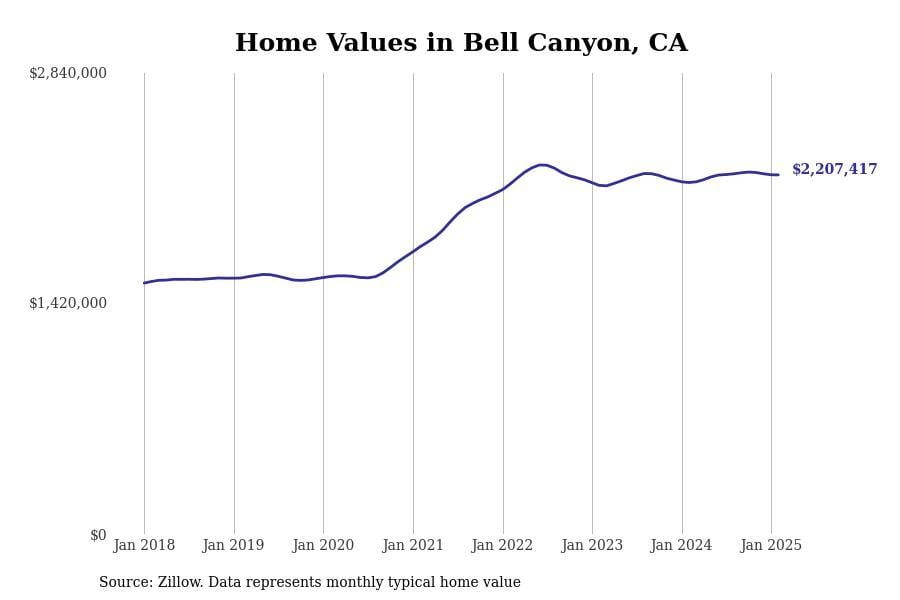
#1. Bell Canyon, CA
- Typical home value: $2,207,417
- 1-year price change: +2.2%
- 5-year price change: +39.5%