 Trump has begun another trade war. Here's a timeline of how we got here
 Canada's leader laments lost friendship with US in town that sheltered stranded Americans after 9/11
 Chinese EV giant BYD's fourth-quarter profit leaps 73%
 You're an American in another land? Prepare to talk about the why and how of Trump 2.0
 Chalk talk: Star power, top teams and No. 5 seeds headline the women's March Madness Sweet 16
 Purdue returns to Sweet 16 with 76-62 win over McNeese in March Madness
Most diverse counties in California
The United States has a longstanding reputation as being a melting pot (or salad bowl), with its diversity manifesting itself across many different demographics. However, some places across the country are notably more heterogeneous than others.
Stacker compiled a list of the most diverse counties in California using data from using data from the U.S. Census Bureau. Counties are ranked by the highest Simpson's diversity index score. Simpson's diversity index measures community diversity on a scale of 0 (least diverse) to 1 (most diverse), more on the calculation can be read here.
Think you know which counties in your home state might be the most diverse? Keep reading to see if your predictions are correct.
You may also like: Metros in California where jobs are growing fastest
#50. El Dorado County
- Index: 0.228
- Total population: 188,563
- White: 87.6% (165,234)
- Black or African American: 0.8% (1,516)
- American Indian and Alaska Native: 0.8% (1,532)
- Asian: 4.5% (8,540)
- Native Hawaiian and other Pacific Islander: 0.3% (486)
- 2 or more races: 3.9% (7,263)
- Some other Race: 2.1% (3,992)
#49. Amador County
- Index: 0.243
- Total population: 38,429
- White: 86.7% (33,327)
- Black or African American: 2.4% (904)
- American Indian and Alaska Native: 0.8% (303)
- Asian: 1.3% (508)
- Native Hawaiian and other Pacific Islander: 0.1% (57)
- 2 or more races: 4.8% (1,830)
- Some other Race: 3.9% (1,500)
#48. Shasta County
- Index: 0.247
- Total population: 179,212
- White: 86.6% (155,124)
- Black or African American: 1.2% (2,088)
- American Indian and Alaska Native: 2.7% (4,832)
- Asian: 3.2% (5,798)
- Native Hawaiian and other Pacific Islander: 0.1% (254)
- 2 or more races: 4.2% (7,509)
- Some other Race: 2.0% (3,607)
#47. Trinity County
- Index: 0.255
- Total population: 12,700
- White: 86.0% (10,924)
- Black or African American: 1.0% (127)
- American Indian and Alaska Native: 5.6% (716)
- Asian: 1.8% (226)
- Native Hawaiian and other Pacific Islander: 0.2% (28)
- 2 or more races: 2.0% (251)
- Some other Race: 3.4% (428)
#46. Tehama County
- Index: 0.259
- Total population: 63,912
- White: 85.7% (54,795)
- Black or African American: 0.8% (530)
- American Indian and Alaska Native: 2.0% (1,255)
- Asian: 1.5% (967)
- Native Hawaiian and other Pacific Islander: 0.0% (28)
- 2 or more races: 4.5% (2,867)
- Some other Race: 5.4% (3,470)
You may also like: California small businesses thrive in these counties
#45. San Luis Obispo County
- Index: 0.265
- Total population: 282,165
- White: 85.5% (241,123)
- Black or African American: 1.9% (5,319)
- American Indian and Alaska Native: 0.9% (2,458)
- Asian: 3.6% (10,296)
- Native Hawaiian and other Pacific Islander: 0.1% (265)
- 2 or more races: 3.7% (10,437)
- Some other Race: 4.3% (12,267)
#44. Siskiyou County
- Index: 0.275
- Total population: 43,468
- White: 84.8% (36,847)
- Black or African American: 1.6% (695)
- American Indian and Alaska Native: 3.7% (1,618)
- Asian: 1.6% (708)
- Native Hawaiian and other Pacific Islander: 0.4% (157)
- 2 or more races: 6.5% (2,807)
- Some other Race: 1.5% (636)
#43. Mendocino County
- Index: 0.294
- Total population: 87,224
- White: 83.6% (72,935)
- Black or African American: 0.7% (628)
- American Indian and Alaska Native: 4.4% (3,818)
- Asian: 2.1% (1,805)
- Native Hawaiian and other Pacific Islander: 0.2% (165)
- 2 or more races: 4.9% (4,290)
- Some other Race: 4.1% (3,583)
#42. Mono County
- Index: 0.299
- Total population: 14,310
- White: 83.3% (11,921)
- Black or African American: 0.8% (111)
- American Indian and Alaska Native: 3.5% (497)
- Asian: 2.6% (367)
- Native Hawaiian and other Pacific Islander: 0.0% (0)
- 2 or more races: 3.7% (532)
- Some other Race: 6.2% (882)
#41. Lassen County
- Index: 0.315
- Total population: 30,818
- White: 82.2% (25,324)
- Black or African American: 8.7% (2,686)
- American Indian and Alaska Native: 2.8% (864)
- Asian: 1.4% (428)
- Native Hawaiian and other Pacific Islander: 0.8% (247)
- 2 or more races: 2.5% (759)
- Some other Race: 1.7% (510)
You may also like: How drunk driving fatalities in California compare to the rest of the US
#40. Placer County
- Index: 0.316
- Total population: 385,512
- White: 82.2% (316,716)
- Black or African American: 1.7% (6,626)
- American Indian and Alaska Native: 0.5% (2,052)
- Asian: 7.5% (28,909)
- Native Hawaiian and other Pacific Islander: 0.2% (858)
- 2 or more races: 4.9% (18,993)
- Some other Race: 2.9% (11,358)
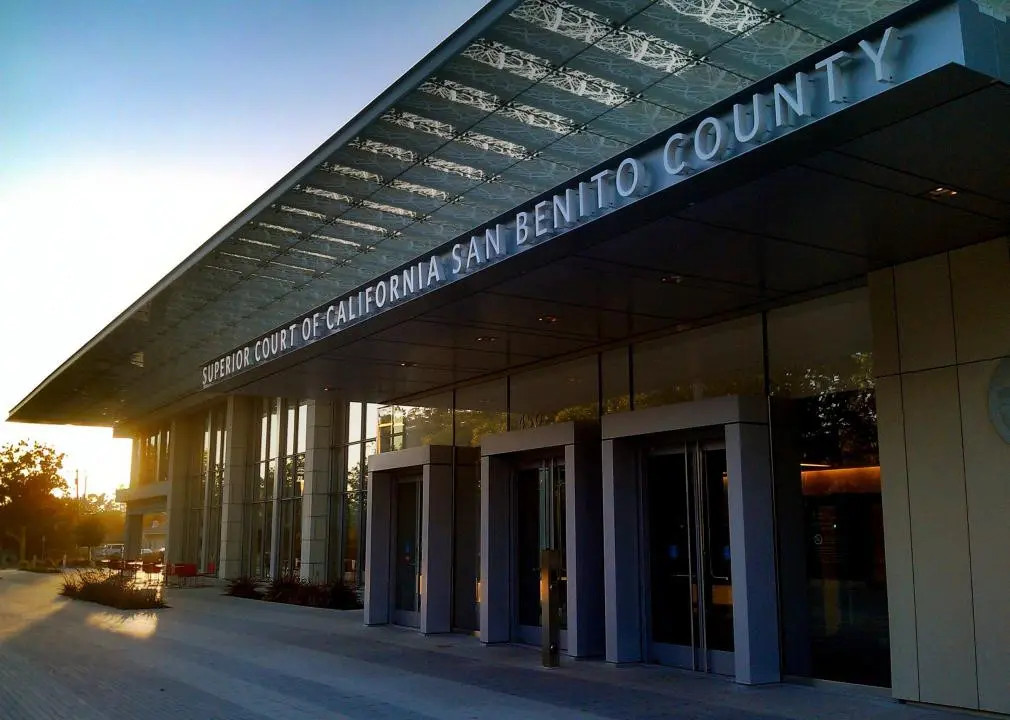
#39. San Benito County
- Index: 0.324
- Total population: 60,376
- White: 81.6% (49,245)
- Black or African American: 0.8% (491)
- American Indian and Alaska Native: 0.7% (443)
- Asian: 3.0% (1,804)
- Native Hawaiian and other Pacific Islander: 0.1% (57)
- 2 or more races: 5.3% (3,198)
- Some other Race: 8.5% (5,138)
#38. Butte County
- Index: 0.326
- Total population: 225,817
- White: 81.6% (184,180)
- Black or African American: 1.5% (3,461)
- American Indian and Alaska Native: 1.2% (2,616)
- Asian: 4.6% (10,432)
- Native Hawaiian and other Pacific Islander: 0.3% (603)
- 2 or more races: 6.1% (13,771)
- Some other Race: 4.8% (10,754)
#37. Glenn County
- Index: 0.330
- Total population: 27,976
- White: 81.1% (22,685)
- Black or African American: 0.8% (230)
- American Indian and Alaska Native: 2.4% (682)
- Asian: 2.9% (825)
- Native Hawaiian and other Pacific Islander: 0.0% (11)
- 2 or more races: 2.3% (645)
- Some other Race: 10.4% (2,898)
#36. Ventura County
- Index: 0.348
- Total population: 847,263
- White: 80.1% (678,658)
- Black or African American: 1.8% (15,594)
- American Indian and Alaska Native: 0.8% (6,760)
- Asian: 7.3% (62,190)
- Native Hawaiian and other Pacific Islander: 0.2% (1,698)
- 2 or more races: 4.5% (38,136)
- Some other Race: 5.2% (44,227)
You may also like: How opioid prescriptions to Medicaid patients in California stack up
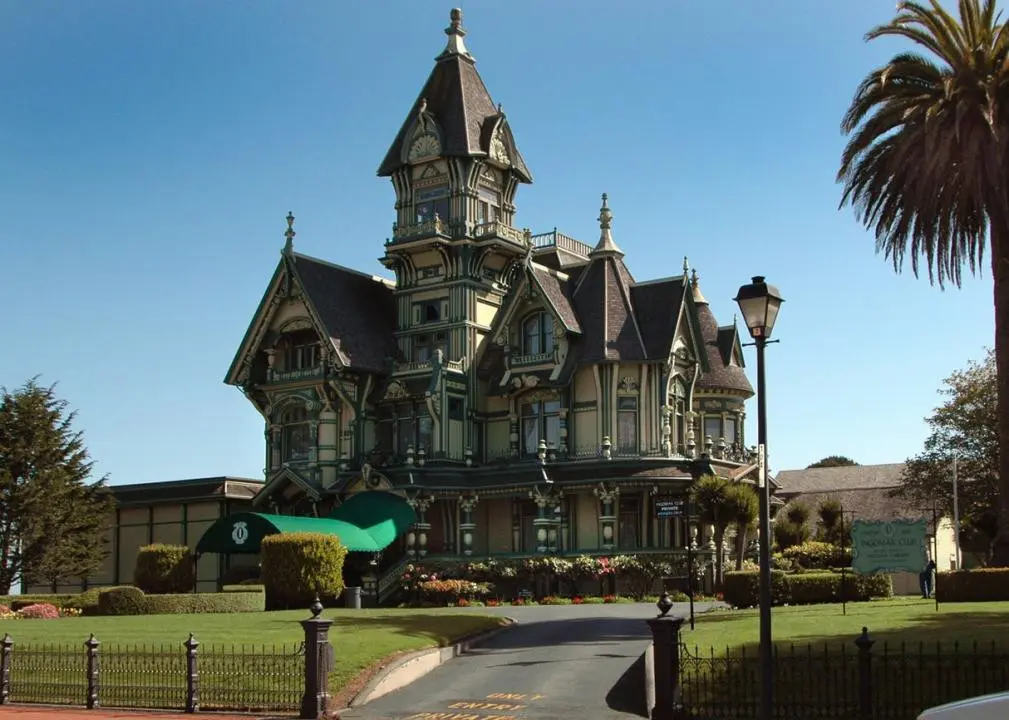
#35. Humboldt County
- Index: 0.353
- Total population: 135,940
- White: 79.9% (108,557)
- Black or African American: 1.1% (1,506)
- American Indian and Alaska Native: 5.0% (6,846)
- Asian: 3.1% (4,196)
- Native Hawaiian and other Pacific Islander: 0.4% (488)
- 2 or more races: 6.4% (8,640)
- Some other Race: 4.2% (5,707)
#34. Inyo County
- Index: 0.363
- Total population: 17,977
- White: 78.8% (14,170)
- Black or African American: 0.9% (153)
- American Indian and Alaska Native: 11.3% (2,028)
- Asian: 1.9% (350)
- Native Hawaiian and other Pacific Islander: 0.2% (34)
- 2 or more races: 4.7% (850)
- Some other Race: 2.2% (392)
#33. Marin County
- Index: 0.381
- Total population: 259,943
- White: 77.8% (202,313)
- Black or African American: 2.2% (5,767)
- American Indian and Alaska Native: 0.4% (911)
- Asian: 5.9% (15,367)
- Native Hawaiian and other Pacific Islander: 0.2% (571)
- 2 or more races: 4.9% (12,756)
- Some other Race: 8.6% (22,258)
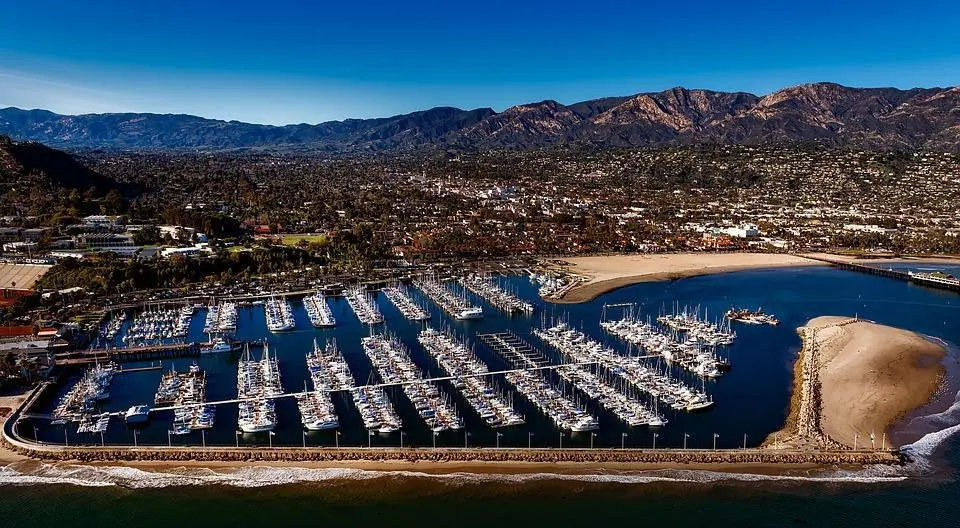
#32. Santa Barbara County
- Index: 0.385
- Total population: 444,829
- White: 77.5% (344,778)
- Black or African American: 2.0% (8,984)
- American Indian and Alaska Native: 1.0% (4,644)
- Asian: 5.6% (24,849)
- Native Hawaiian and other Pacific Islander: 0.1% (581)
- 2 or more races: 4.2% (18,552)
- Some other Race: 9.5% (42,441)
#31. Lake County
- Index: 0.390
- Total population: 64,195
- White: 76.9% (49,389)
- Black or African American: 2.3% (1,447)
- American Indian and Alaska Native: 3.6% (2,310)
- Asian: 1.1% (723)
- Native Hawaiian and other Pacific Islander: 0.1% (42)
- 2 or more races: 3.7% (2,375)
- Some other Race: 12.3% (7,909)
You may also like: Beef steaks, white bread, and other groceries that dropped in price in the West last month
#30. Stanislaus County
- Index: 0.400
- Total population: 543,194
- White: 76.6% (415,911)
- Black or African American: 3.0% (16,547)
- American Indian and Alaska Native: 0.8% (4,418)
- Asian: 5.5% (30,007)
- Native Hawaiian and other Pacific Islander: 0.7% (3,961)
- 2 or more races: 4.2% (22,564)
- Some other Race: 9.2% (49,786)
#29. Yuba County
- Index: 0.409
- Total population: 76,360
- White: 76.0% (58,016)
- Black or African American: 3.4% (2,621)
- American Indian and Alaska Native: 1.2% (936)
- Asian: 6.8% (5,201)
- Native Hawaiian and other Pacific Islander: 0.5% (351)
- 2 or more races: 7.4% (5,654)
- Some other Race: 4.7% (3,581)
#28. Santa Cruz County
- Index: 0.417
- Total population: 273,962
- White: 74.8% (204,866)
- Black or African American: 1.1% (2,904)
- American Indian and Alaska Native: 0.5% (1,505)
- Asian: 4.8% (13,134)
- Native Hawaiian and other Pacific Islander: 0.1% (337)
- 2 or more races: 4.8% (13,086)
- Some other Race: 13.9% (38,130)
#27. Sonoma County
- Index: 0.419
- Total population: 499,772
- White: 74.8% (373,667)
- Black or African American: 1.7% (8,269)
- American Indian and Alaska Native: 0.9% (4,395)
- Asian: 4.1% (20,443)
- Native Hawaiian and other Pacific Islander: 0.3% (1,606)
- 2 or more races: 5.4% (26,761)
- Some other Race: 12.9% (64,631)
#26. Del Norte County
- Index: 0.426
- Total population: 27,495
- White: 74.9% (20,581)
- Black or African American: 3.4% (940)
- American Indian and Alaska Native: 7.2% (1,986)
- Asian: 3.2% (888)
- Native Hawaiian and other Pacific Islander: 0.2% (44)
- 2 or more races: 6.3% (1,736)
- Some other Race: 4.8% (1,320)
You may also like: Highest-rated breweries in California
#25. Tulare County
- Index: 0.427
- Total population: 461,898
- White: 73.7% (340,462)
- Black or African American: 1.6% (7,201)
- American Indian and Alaska Native: 1.3% (6,118)
- Asian: 3.6% (16,690)
- Native Hawaiian and other Pacific Islander: 0.2% (766)
- 2 or more races: 3.4% (15,712)
- Some other Race: 16.2% (74,949)
#24. Kern County
- Index: 0.429
- Total population: 887,641
- White: 74.4% (660,147)
- Black or African American: 5.5% (48,550)
- American Indian and Alaska Native: 1.0% (8,969)
- Asian: 4.7% (42,100)
- Native Hawaiian and other Pacific Islander: 0.2% (1,678)
- 2 or more races: 3.5% (31,032)
- Some other Race: 10.7% (95,165)
#23. Napa County
- Index: 0.440
- Total population: 139,623
- White: 73.4% (102,467)
- Black or African American: 2.1% (2,883)
- American Indian and Alaska Native: 0.9% (1,196)
- Asian: 8.1% (11,352)
- Native Hawaiian and other Pacific Islander: 0.2% (301)
- 2 or more races: 3.9% (5,380)
- Some other Race: 11.5% (16,044)
#22. Madera County
- Index: 0.473
- Total population: 155,433
- White: 69.5% (108,100)
- Black or African American: 3.2% (4,949)
- American Indian and Alaska Native: 1.6% (2,489)
- Asian: 2.1% (3,229)
- Native Hawaiian and other Pacific Islander: 0.1% (176)
- 2 or more races: 3.3% (5,061)
- Some other Race: 20.2% (31,429)
#21. San Diego County
- Index: 0.477
- Total population: 3.3 million
- White: 70.7% (2,345,667)
- Black or African American: 5.0% (166,750)
- American Indian and Alaska Native: 0.7% (22,524)
- Asian: 11.9% (394,742)
- Native Hawaiian and other Pacific Islander: 0.4% (13,867)
- 2 or more races: 5.2% (173,794)
- Some other Race: 6.0% (198,729)
You may also like: Healthy hotspots: The most physically active counties in California
#20. Yolo County
- Index: 0.491
- Total population: 217,352
- White: 69.3% (150,617)
- Black or African American: 2.7% (5,847)
- American Indian and Alaska Native: 0.6% (1,306)
- Asian: 14.0% (30,462)
- Native Hawaiian and other Pacific Islander: 0.4% (955)
- 2 or more races: 6.3% (13,659)
- Some other Race: 6.7% (14,506)
#19. Sutter County
- Index: 0.492
- Total population: 96,109
- White: 69.0% (66,293)
- Black or African American: 1.9% (1,827)
- American Indian and Alaska Native: 0.9% (878)
- Asian: 15.7% (15,048)
- Native Hawaiian and other Pacific Islander: 0.6% (548)
- 2 or more races: 7.1% (6,785)
- Some other Race: 4.9% (4,730)
#18. Imperial County
- Index: 0.506
- Total population: 180,701
- White: 65.1% (117,658)
- Black or African American: 2.5% (4,489)
- American Indian and Alaska Native: 1.1% (1,912)
- Asian: 1.5% (2,680)
- Native Hawaiian and other Pacific Islander: 0.2% (309)
- 2 or more races: 3.6% (6,514)
- Some other Race: 26.1% (47,139)
#17. Kings County
- Index: 0.508
- Total population: 150,691
- White: 67.7% (102,062)
- Black or African American: 6.4% (9,642)
- American Indian and Alaska Native: 1.6% (2,431)
- Asian: 3.9% (5,817)
- Native Hawaiian and other Pacific Islander: 0.2% (277)
- 2 or more races: 4.1% (6,143)
- Some other Race: 16.1% (24,319)
#16. Fresno County
- Index: 0.542
- Total population: 984,521
- White: 65.0% (639,985)
- Black or African American: 4.8% (46,782)
- American Indian and Alaska Native: 1.2% (11,656)
- Asian: 10.3% (101,857)
- Native Hawaiian and other Pacific Islander: 0.2% (1,620)
- 2 or more races: 4.1% (40,384)
- Some other Race: 14.4% (142,237)
You may also like: Where people in California are moving to most
#15. Alpine County
- Index: 0.550
- Total population: 1,039
- White: 57.7% (599)
- Black or African American: 0.9% (9)
- American Indian and Alaska Native: 34.0% (353)
- Asian: 1.0% (10)
- Native Hawaiian and other Pacific Islander: 0.6% (6)
- 2 or more races: 5.1% (53)
- Some other Race: 0.9% (9)
#14. Orange County
- Index: 0.570
- Total population: 3.2 million
- White: 61.0% (1,931,263)
- Black or African American: 1.8% (55,591)
- American Indian and Alaska Native: 0.5% (14,424)
- Asian: 20.5% (649,042)
- Native Hawaiian and other Pacific Islander: 0.3% (10,152)
- 2 or more races: 4.1% (130,009)
- Some other Race: 11.9% (377,563)
#13. San Bernardino County
- Index: 0.581
- Total population: 2.1 million
- White: 61.2% (1,315,238)
- Black or African American: 8.3% (179,292)
- American Indian and Alaska Native: 0.8% (17,782)
- Asian: 7.2% (154,332)
- Native Hawaiian and other Pacific Islander: 0.3% (6,838)
- 2 or more races: 5.0% (106,949)
- Some other Race: 17.2% (368,600)
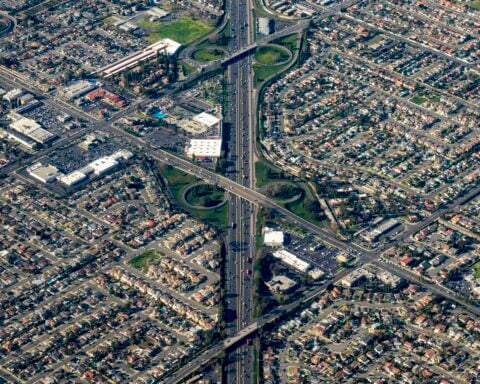
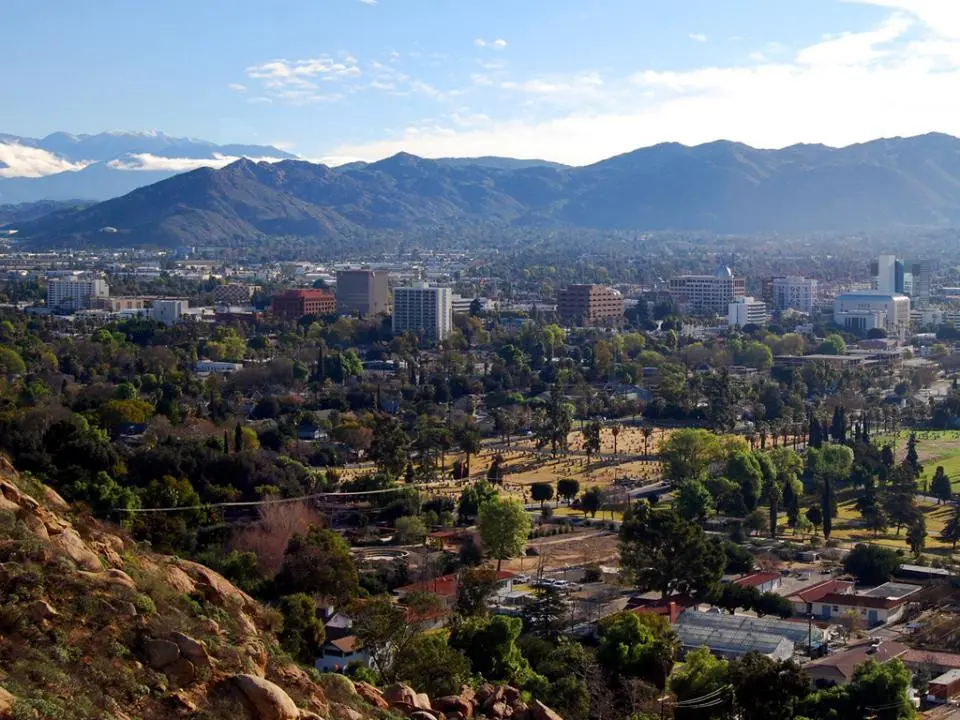
#12. Riverside County
- Index: 0.584
- Total population: 2.4 million
- White: 59.9% (1,444,654)
- Black or African American: 6.5% (156,836)
- American Indian and Alaska Native: 0.8% (19,765)
- Asian: 6.5% (157,261)
- Native Hawaiian and other Pacific Islander: 0.3% (7,485)
- 2 or more races: 4.4% (106,316)
- Some other Race: 21.5% (519,122)
#11. Monterey County
- Index: 0.601
- Total population: 433,410
- White: 53.3% (230,992)
- Black or African American: 2.6% (11,367)
- American Indian and Alaska Native: 0.7% (2,993)
- Asian: 5.6% (24,326)
- Native Hawaiian and other Pacific Islander: 0.5% (2,135)
- 2 or more races: 4.3% (18,556)
- Some other Race: 33.0% (143,041)
You may also like: Cities with the most expensive homes in California
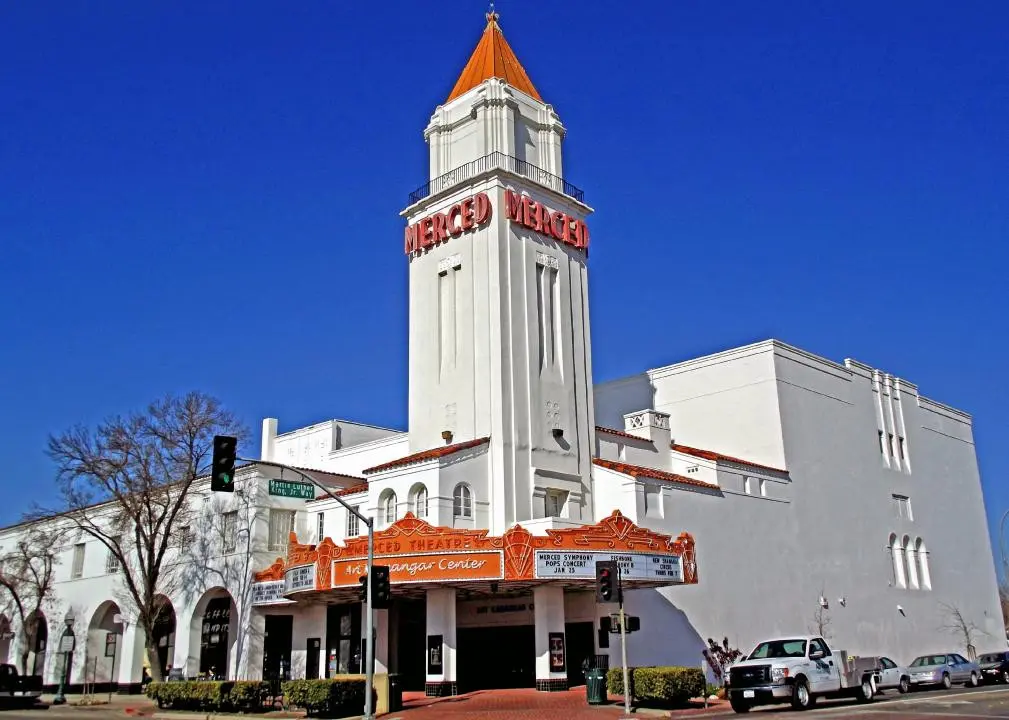
#10. Merced County
- Index: 0.604
- Total population: 271,382
- White: 55.1% (149,434)
- Black or African American: 3.2% (8,645)
- American Indian and Alaska Native: 0.9% (2,501)
- Asian: 7.5% (20,349)
- Native Hawaiian and other Pacific Islander: 0.2% (654)
- 2 or more races: 4.1% (11,064)
- Some other Race: 29.0% (78,735)
#9. Sacramento County
- Index: 0.625
- Total population: 1.5 million
- White: 57.3% (873,905)
- Black or African American: 9.8% (149,891)
- American Indian and Alaska Native: 0.7% (10,111)
- Asian: 15.7% (239,447)
- Native Hawaiian and other Pacific Islander: 1.1% (17,400)
- 2 or more races: 7.5% (113,877)
- Some other Race: 7.9% (119,922)
#8. San Joaquin County
- Index: 0.632
- Total population: 742,603
- White: 56.5% (419,288)
- Black or African American: 7.0% (51,931)
- American Indian and Alaska Native: 0.6% (4,706)
- Asian: 15.6% (115,531)
- Native Hawaiian and other Pacific Islander: 0.6% (4,565)
- 2 or more races: 10.9% (81,198)
- Some other Race: 8.8% (65,384)
#7. Contra Costa County
- Index: 0.636
- Total population: 1.1 million
- White: 55.8% (637,904)
- Black or African American: 8.7% (99,642)
- American Indian and Alaska Native: 0.5% (5,506)
- Asian: 16.7% (190,983)
- Native Hawaiian and other Pacific Islander: 0.5% (5,631)
- 2 or more races: 6.8% (77,956)
- Some other Race: 10.9% (124,629)
#6. San Mateo County
- Index: 0.646
- Total population: 767,423
- White: 50.6% (388,318)
- Black or African American: 2.3% (17,784)
- American Indian and Alaska Native: 0.4% (3,002)
- Asian: 28.7% (220,151)
- Native Hawaiian and other Pacific Islander: 1.4% (10,366)
- 2 or more races: 5.7% (43,492)
- Some other Race: 11.0% (84,310)
You may also like: Best places to live in California
#5. San Francisco County
- Index: 0.655
- Total population: 874,961
- White: 46.4% (406,056)
- Black or African American: 5.2% (45,556)
- American Indian and Alaska Native: 0.4% (3,223)
- Asian: 34.4% (301,018)
- Native Hawaiian and other Pacific Islander: 0.4% (3,188)
- 2 or more races: 5.6% (48,713)
- Some other Race: 7.7% (67,207)
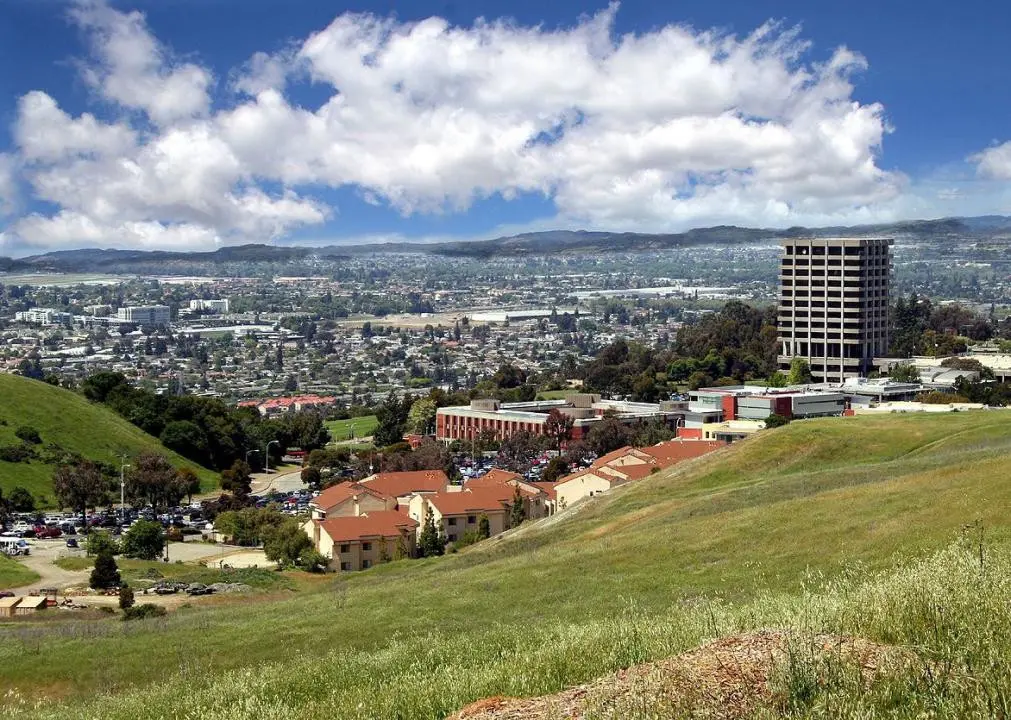
#4. Santa Clara County
- Index: 0.655
- Total population: 1.9 million
- White: 44.5% (857,092)
- Black or African American: 2.5% (47,992)
- American Indian and Alaska Native: 0.5% (9,697)
- Asian: 36.5% (702,881)
- Native Hawaiian and other Pacific Islander: 0.4% (7,271)
- 2 or more races: 5.2% (100,143)
- Some other Race: 10.5% (202,394)
#3. Los Angeles County
- Index: 0.664
- Total population: 10.1 million
- White: 51.3% (5,168,443)
- Black or African American: 8.1% (820,478)
- American Indian and Alaska Native: 0.7% (73,393)
- Asian: 14.6% (1,473,221)
- Native Hawaiian and other Pacific Islander: 0.3% (27,720)
- 2 or more races: 4.0% (402,767)
- Some other Race: 21.0% (2,115,548)
#2. Solano County
- Index: 0.666
- Total population: 441,829
- White: 52.6% (232,437)
- Black or African American: 13.9% (61,526)
- American Indian and Alaska Native: 0.5% (2,215)
- Asian: 15.4% (68,200)
- Native Hawaiian and other Pacific Islander: 0.9% (4,101)
- 2 or more races: 7.5% (33,004)
- Some other Race: 9.1% (40,346)
#1. Alameda County
- Index: 0.718
- Total population: 1.7 million
- White: 40.5% (670,364)
- Black or African American: 10.6% (175,751)
- American Indian and Alaska Native: 0.7% (11,120)
- Asian: 30.1% (499,382)
- Native Hawaiian and other Pacific Islander: 0.8% (13,900)
- 2 or more races: 6.5% (106,993)
- Some other Race: 10.8% (179,244)
You may also like: California ranks #25 in mental health care deserts