By Scott DiSavino
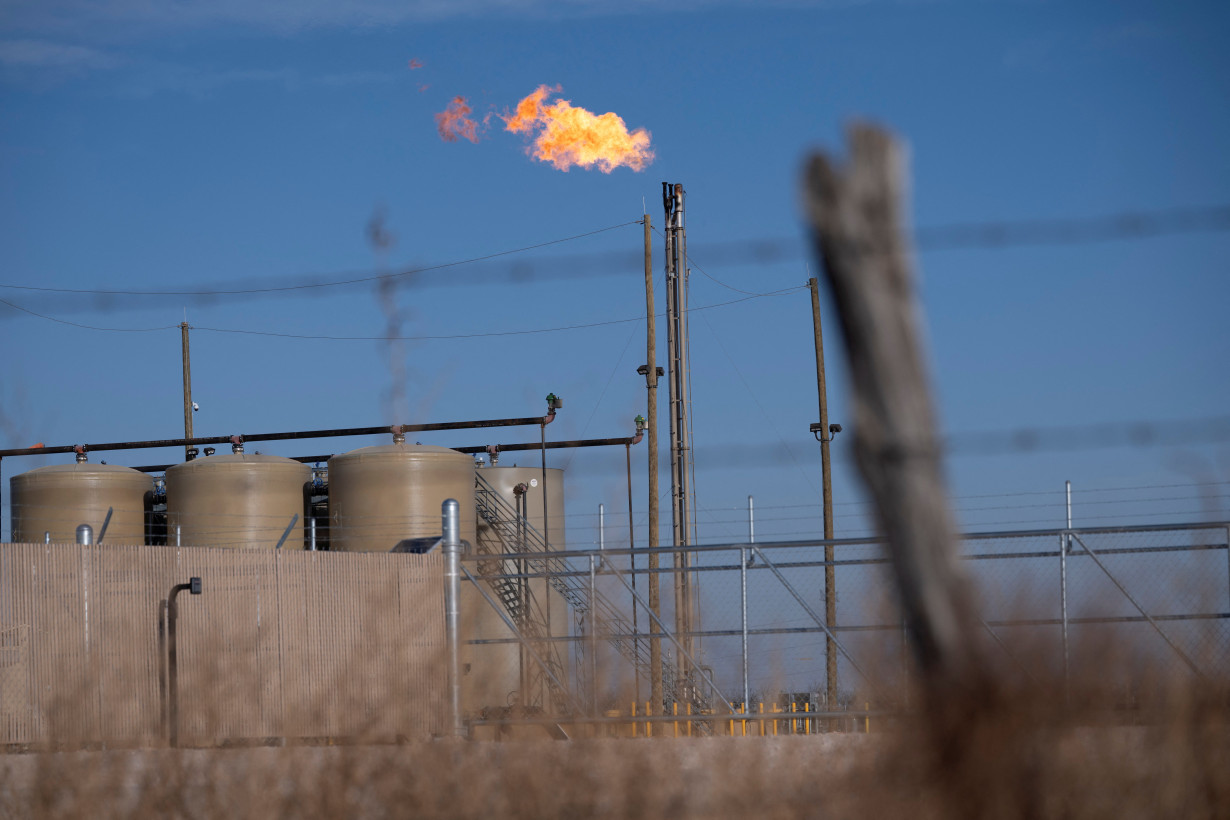
(Reuters) -U.S. natural gas futures climbed about 3% to a one-week high on Friday on record flows to liquefied natural gas export plants and a decline in daily output.
On its first day as the front month, gas futures for May delivery on the New York Mercantile Exchange rose 11.5 cents, or 2.9%, to settle at $4.065 per million British thermal units, their highest close since March 19.
For the week, the contract was up about 2% after sliding about 3% in the prior week.
Mild weather and low demand through mid-April should allow utilities to keep adding gas to storage in coming weeks with some analysts saying stockpiles were on track to increase in March for the first time since 2012 and only the second time in history.
Gas stockpiles, however, were still about 5% below normal levels for this time of year after extremely cold weather in January and February forced energy firms to pull large amounts of gas out of storage, including record amounts in January. [EIA/GAS] [NGAS/POLL]
Mild weather and ample hydropower in the U.S. West caused spot power prices at the South Path 15 (SP-15) hub in Southern California to turn negative for the first time since June 2024. Power prices at SP-15 first fell into negative territory in 2024, averaging below zero on 18 days last year, according to data from financial firm LSEG going back to 2001.
Next-day prices at SP-15 fell to minus $5.23 per megawatt hour. That compares with an average of $28.05 so far in 2025, $31.30 in 2024 and an average of $58.87 during the prior five years (2019-2023).
At the Mid-Columbia hub in Oregon, meanwhile, next-day power prices dropped to $6.57 per MWh, their lowest since May 2023.
SUPPLY AND DEMAND
Financial firm LSEG said average gas output in the Lower 48 U.S. states rose to 106.0 billion cubic feet per day so far in March from a record 105.1 bcfd in February.
On a daily basis, however, output was on track to drop about 2 bcfd over the past four days to a preliminary one-week low of 105.2 bcfd on Friday. Traders noted preliminary data was often changed later in the day.
Meteorologists projected temperatures in the Lower 48 states would remain mostly warmer than normal through April 12.
LSEG forecast average gas demand in the Lower 48, including exports, will slide from 108.5 bcfd this week to 102.9 bcfd next week before edging up to 103.3 bcfd in two weeks. The forecasts for this week and next were lower than LSEG's outlook on Thursday.
Gas flowing to the eight big operating U.S. LNG export plants rose to an average of 15.8 bcfd so far in March, from a record 15.6 bcfd in February, as new units at Venture Global's 3.2-bcfd Plaquemines LNG plant under construction in Louisiana entered service.
The U.S. became the world's biggest LNG supplier in 2023, surpassing Australia and Qatar, as surging global prices fed demand for more exports due in part to supply disruptions and sanctions linked to Russia's 2022 invasion of Ukraine.
Gas traded around $13 per mmBtu at both the Dutch Title Transfer Facility (TTF) benchmark in Europe and the Japan Korea Marker (JKM) benchmark in Asia. [NG/EU]
Week ended Week ended Year ago Five-year
Mar 28 Mar 21 Mar 28 average
Forecast Actual Mar 28
U.S. weekly natgas storage change (bcf): +15 +37 -37 -13
U.S. total natgas in storage (bcf): 1,759 1,744 2,264 1,853
U.S. total storage versus 5-year average -5.1% -6.5%
Global Gas Benchmark Futures ($ per mmBtu) Current Day Prior Day This Month Prior Year Five-Year
Last Year Average Average
2024 (2019-2023)
Henry Hub 3.84 3.93 1.75 2.41 3.52
Title Transfer Facility (TTF) 13.01 12.98 8.54 10.95 15.47
Japan Korea Marker (JKM) 13.18 13.20 8.95 11.89 15.23
LSEG Heating (HDD), Cooling (CDD) and Total (TDD) Degree Days
Two-Week Total Forecast Current Day Prior Day Prior Year 10-Year 30-Year
Norm Norm
U.S. GFS HDDs 184 181 233 219 207
U.S. GFS CDDs 31 34 31 23 22
U.S. GFS TDDs 215 215 264 242 229
LSEG U.S. Weekly GFS Supply and Demand Forecasts
Prior Week Current Next Week This Week Five-Year
Week Last Year (2020-2024)
Average For
Month
U.S. Supply (bcfd)
U.S. Lower 48 Dry Production 106.1 106.4 106.0 101.6 97.5
U.S. Imports from Canada 8.8 8.8 8.1 N/A 7.8
U.S. LNG Imports 0.0 0.0 0.0 0.0 0.1
Total U.S. Supply 114.8 115.2 114.1 N/A 105.4
U.S. Demand (bcfd)
U.S. Exports to Canada 4.0 3.4 3.4 N/A 3.3
U.S. Exports to Mexico 6.0 6.3 6.3 N/A 5.4
U.S. LNG Exports 16.0 16.1 16.1 12.9 11.8
U.S. Commercial 10.4 10.4 8.9 11.3 11.8
U.S. Residential 15.7 15.1 12.5 16.9 18.3
U.S. Power Plant 24.1 26.1 25.4 28.6 27.5
U.S. Industrial 23.5 23.7 23.0 24.3 23.8
U.S. Plant Fuel 5.2 5.3 5.2 5.2 5.2
U.S. Pipe Distribution 2.2 2.2 2.1 2.2 3.3
U.S. Vehicle Fuel 0.1 0.1 0.1 0.1 0.2
Total U.S. Consumption 81.2 82.8 77.2 88.6 90.1
Total U.S. Demand 107.1 108.5 102.9 N/A 110.6
N/A is Not Available
U.S. Northwest River Forecast Center (NWRFC) at The Dalles Dam 2025 2025 2024 2023 2022
(Fiscal year ending Sep 30) Current Day Prior Day % of Normal % of Normal % of Normal
% of Normal % of Normal Actual Actual Actual
Forecast Forecast
Apr-Sep 95 97 74 83 107
Jan-Jul 93 95 76 77 102
Oct-Sep 93 94 77 76 103
U.S. weekly power generation percent by fuel - EIA
Week ended Week ended 2024 2023 2022
Mar 21 Mar 14
Wind 14 18 11 10 11
Solar 7 7 5 4 3
Hydro 7 7 6 6 6
Other 1 1 1 2 2
Petroleum 0 0 0 0 0
Natural Gas 35 32 42 41 38
Coal 16 14 16 17 21
Nuclear 19 20 19 19 19
SNL U.S. Natural Gas Next-Day Prices ($ per mmBtu)
Hub Current Day Prior Day
Henry Hub 3.88 3.84
Transco Z6 New York 2.83 3.14
PG&E Citygate 2.20 2.34
Eastern Gas (old Dominion South) 2.78 3.09
Chicago Citygate 3.00 3.27
Algonquin Citygate 3.05 3.51
SoCal Citygate 2.15 2.51
Waha Hub 0.54 0.47
AECO 2.01 2.04
ICE U.S. Power Next-Day Prices ($ per megawatt-hour)
Hub Current Day Prior Day
New England 40.67 40.67
PJM West 39.16 49.92
Mid C 6.57 13.13
Palo Verde 9.88 16.00
SP-15 -5.23 4.52
(Reporting by Scott DiSavino; Editing by Andrea Ricci and Rod Nickel)

 Trump has begun another trade war. Here's a timeline of how we got here
 Canada's leader laments lost friendship with US in town that sheltered stranded Americans after 9/11
 Chinese EV giant BYD's fourth-quarter profit leaps 73%
 You're an American in another land? Prepare to talk about the why and how of Trump 2.0
 Chalk talk: Star power, top teams and No. 5 seeds headline the women's March Madness Sweet 16
 Purdue returns to Sweet 16 with 76-62 win over McNeese in March Madness


